library(patchwork)

plot_1 <- ggplot2::diamonds |>
  ggplot2::ggplot() +
  ggplot2::geom_histogram(
    ggplot2::aes(price)
  )

plot_2 <- ggplot2::diamonds |>
  ggplot2::ggplot() +
  ggplot2::geom_boxplot(
    ggplot2::aes(color, price)
  ) +
  ggplot2::labs(
    x = "カラット数", y = "価格"
)ggplot2と他パッケージとの連携
グラフの連結
- patchwork パッケージを使えば、プロットを連結して出力できる
横に連結
plot_1 + plot_2`stat_bin()` using `bins = 30`. Pick better value with `binwidth`.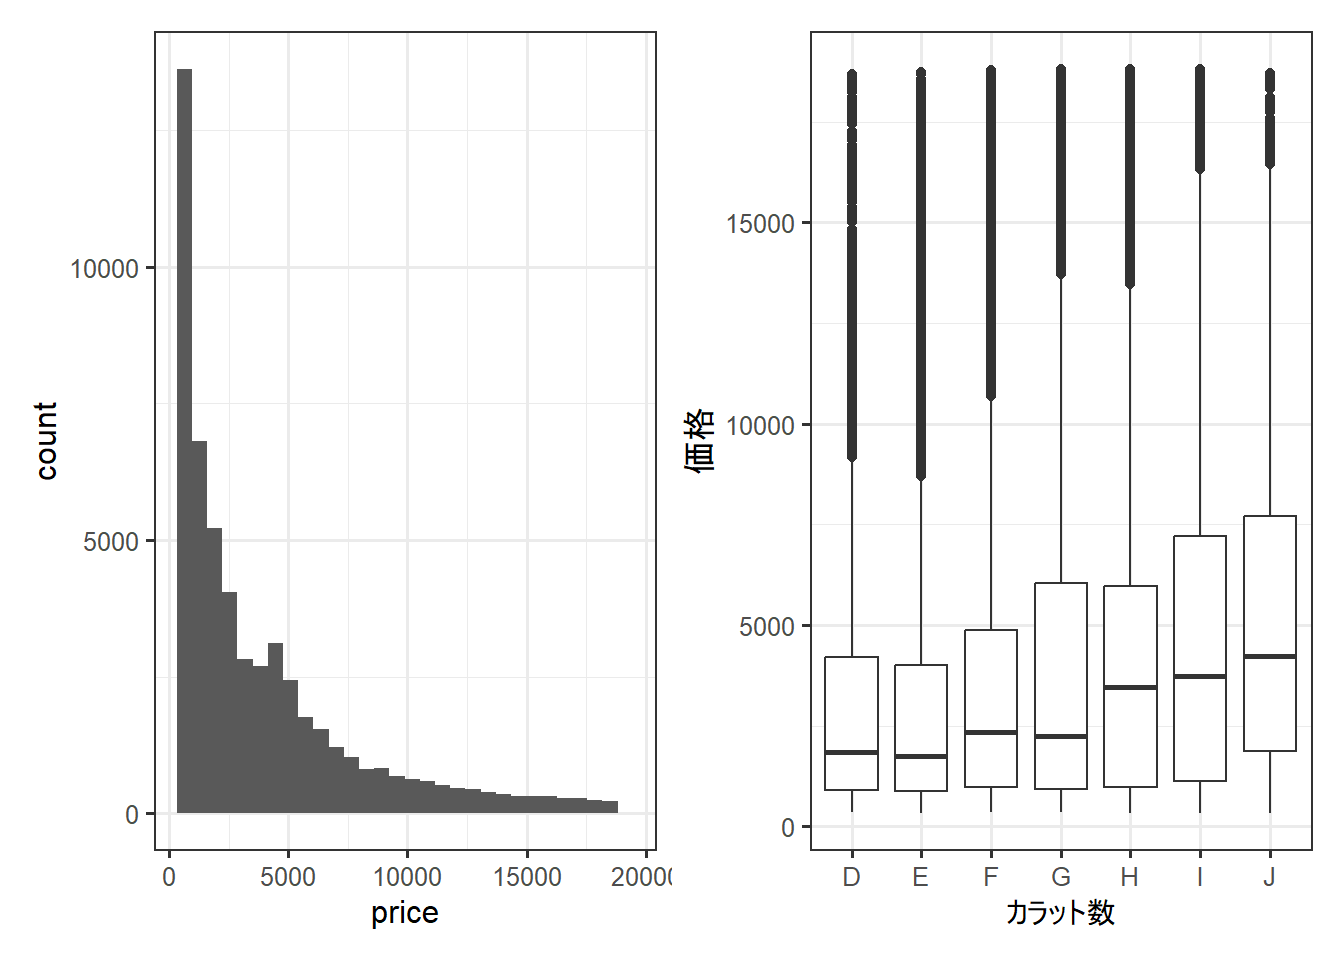
縦に連結
plot_1 / plot_2`stat_bin()` using `bins = 30`. Pick better value with `binwidth`.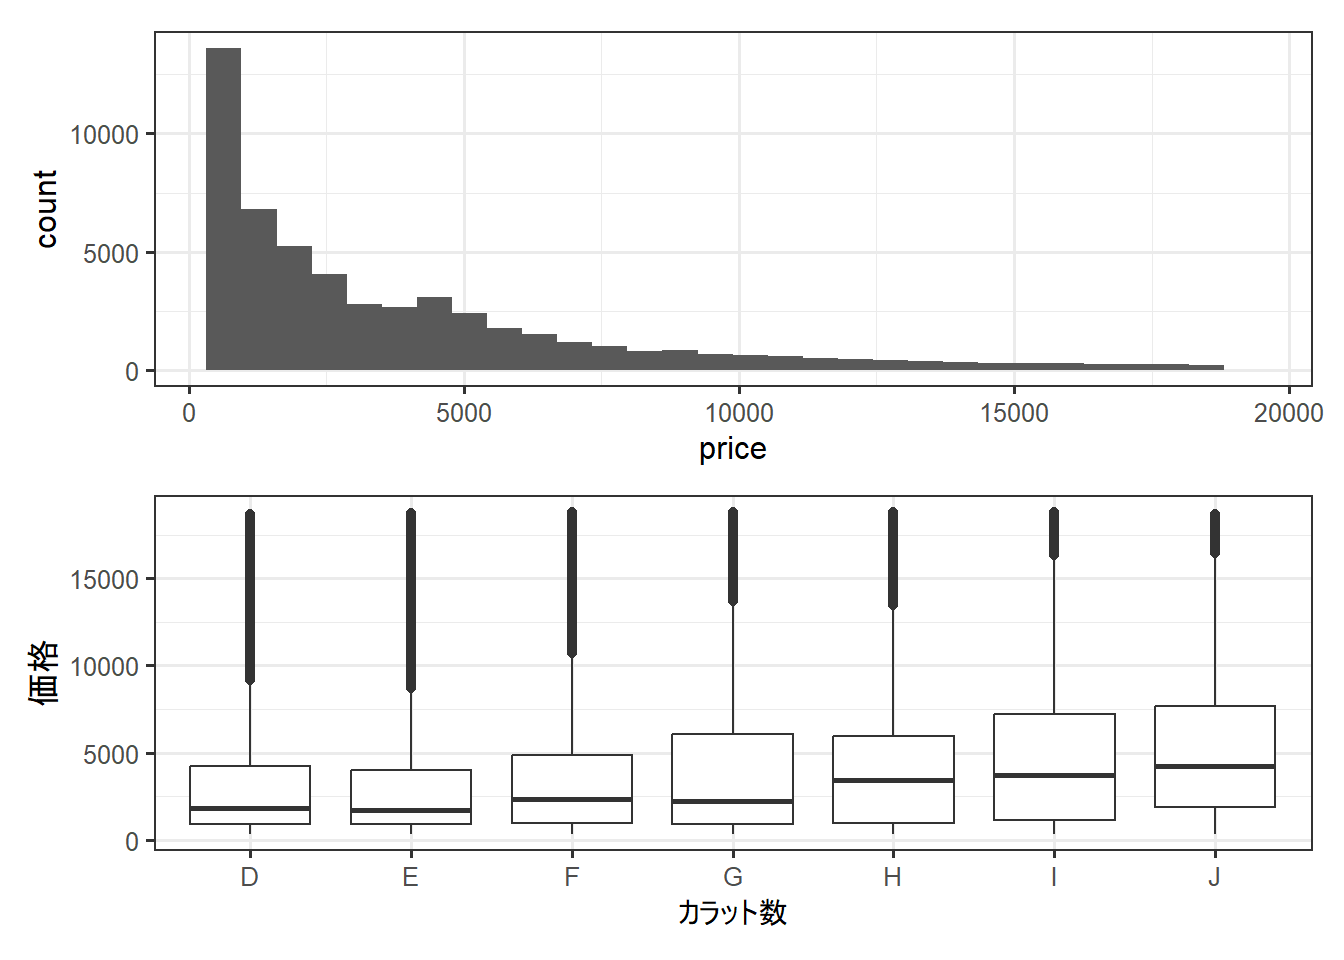
横・縦を指定
(plot_1 | (plot_2 / plot_1))`stat_bin()` using `bins = 30`. Pick better value with `binwidth`.
`stat_bin()` using `bins = 30`. Pick better value with `binwidth`.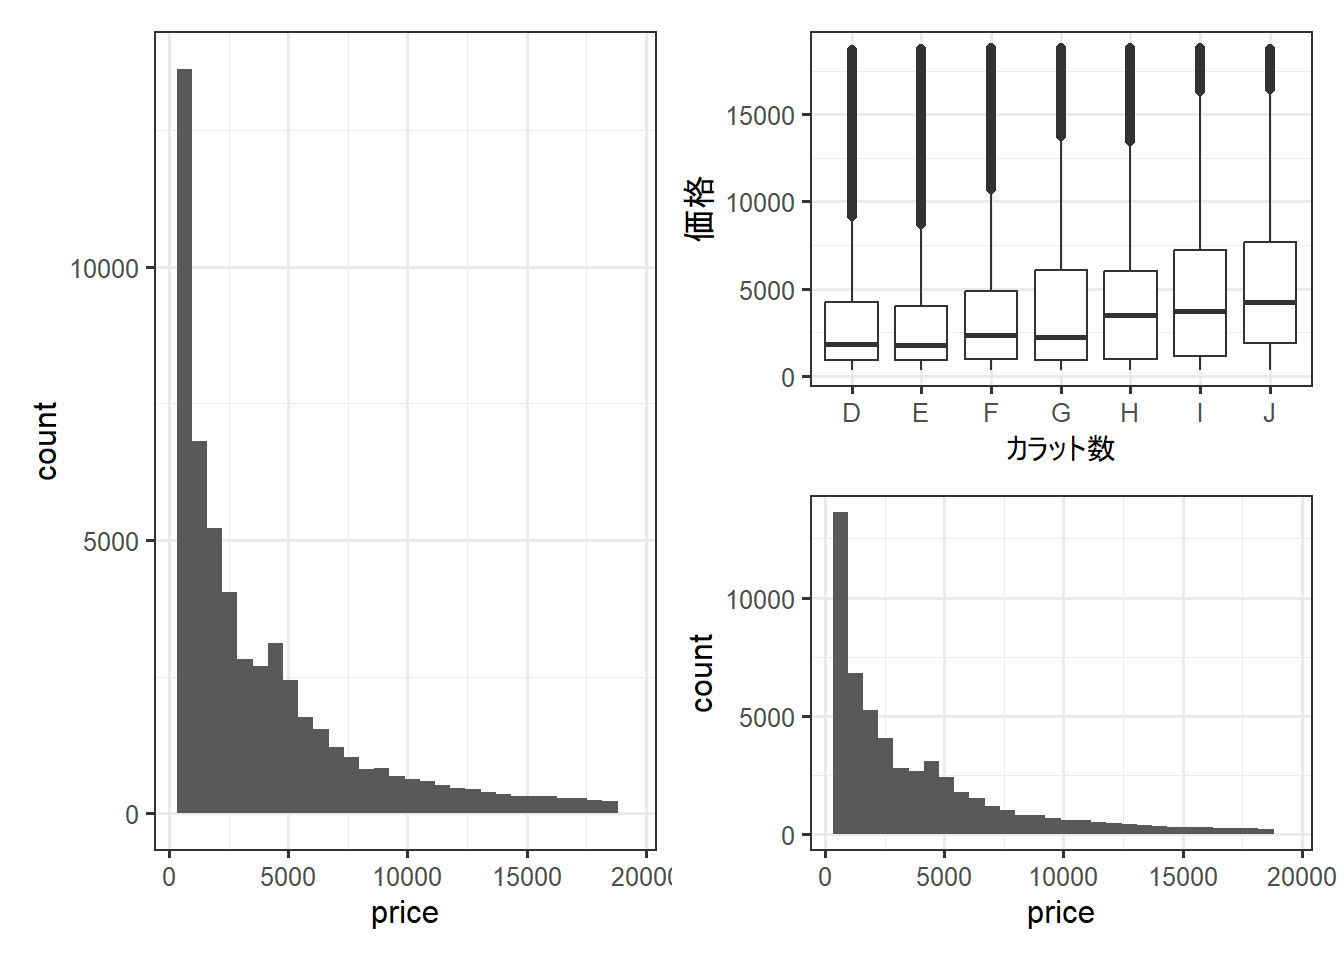
データ観察用のグラフの作成
- GGally::ggpairs 関数が便利
ggplot2::diamonds |>
  GGally::ggpairs(
    data = _,
    columns = c("carat", "price", "clarity"),
    columnLabels = c("カラット数", "価格", "透明度") # 出力するグラフの列名を指定できる
    )
Registered S3 method overwritten by 'GGally':
method from
+.gg ggplot2`stat_bin()` using `bins = 30`. Pick better value with `binwidth`.
`stat_bin()` using `bins = 30`. Pick better value with `binwidth`.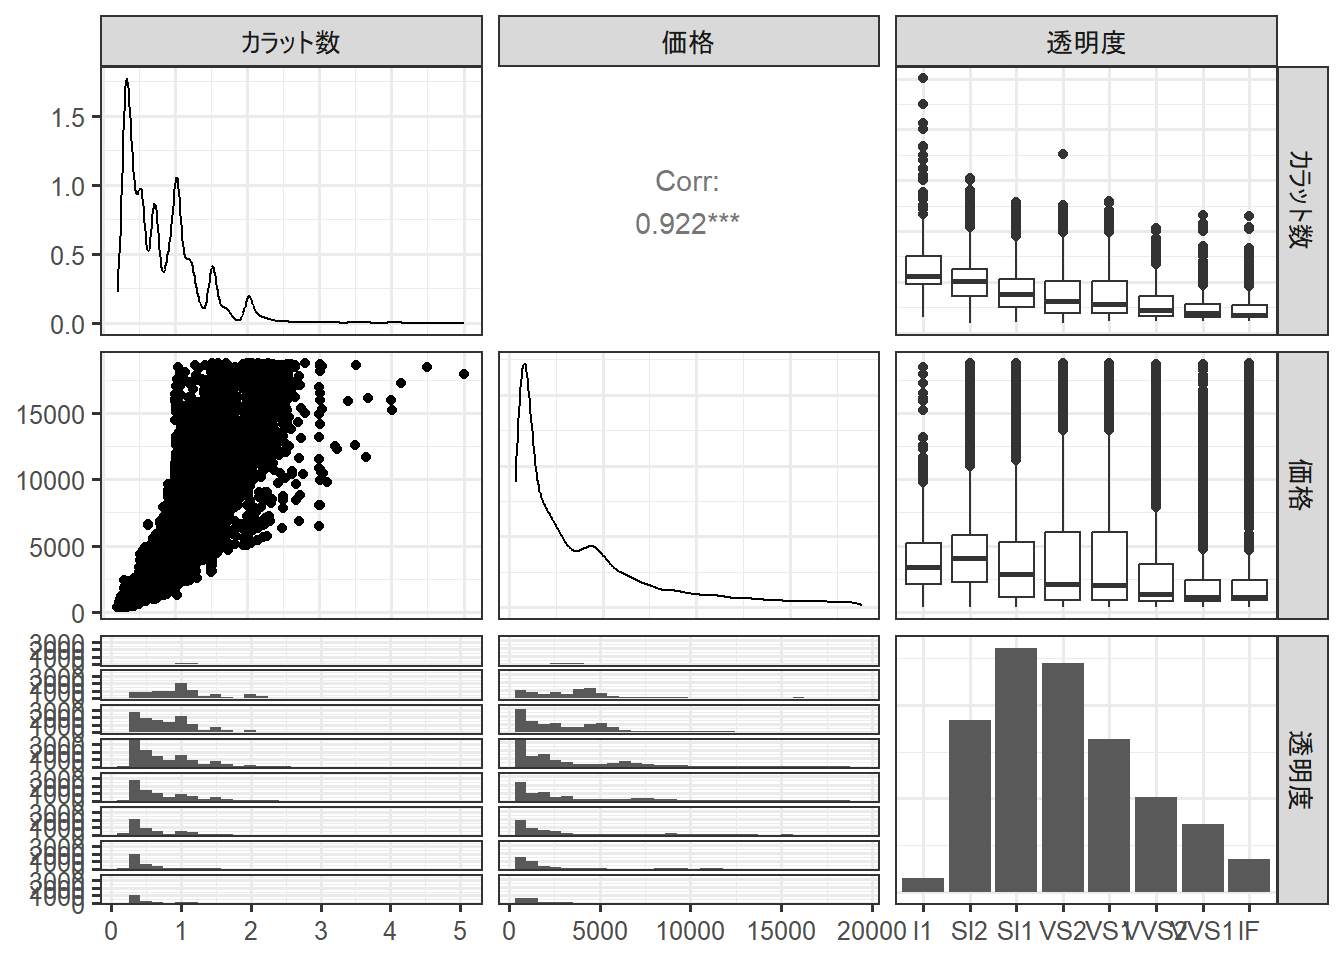
グラフ要素の操作
- forcats パッケージは、グラフの軸の値の順番、凡例の要素の順番などの操作に役立つ
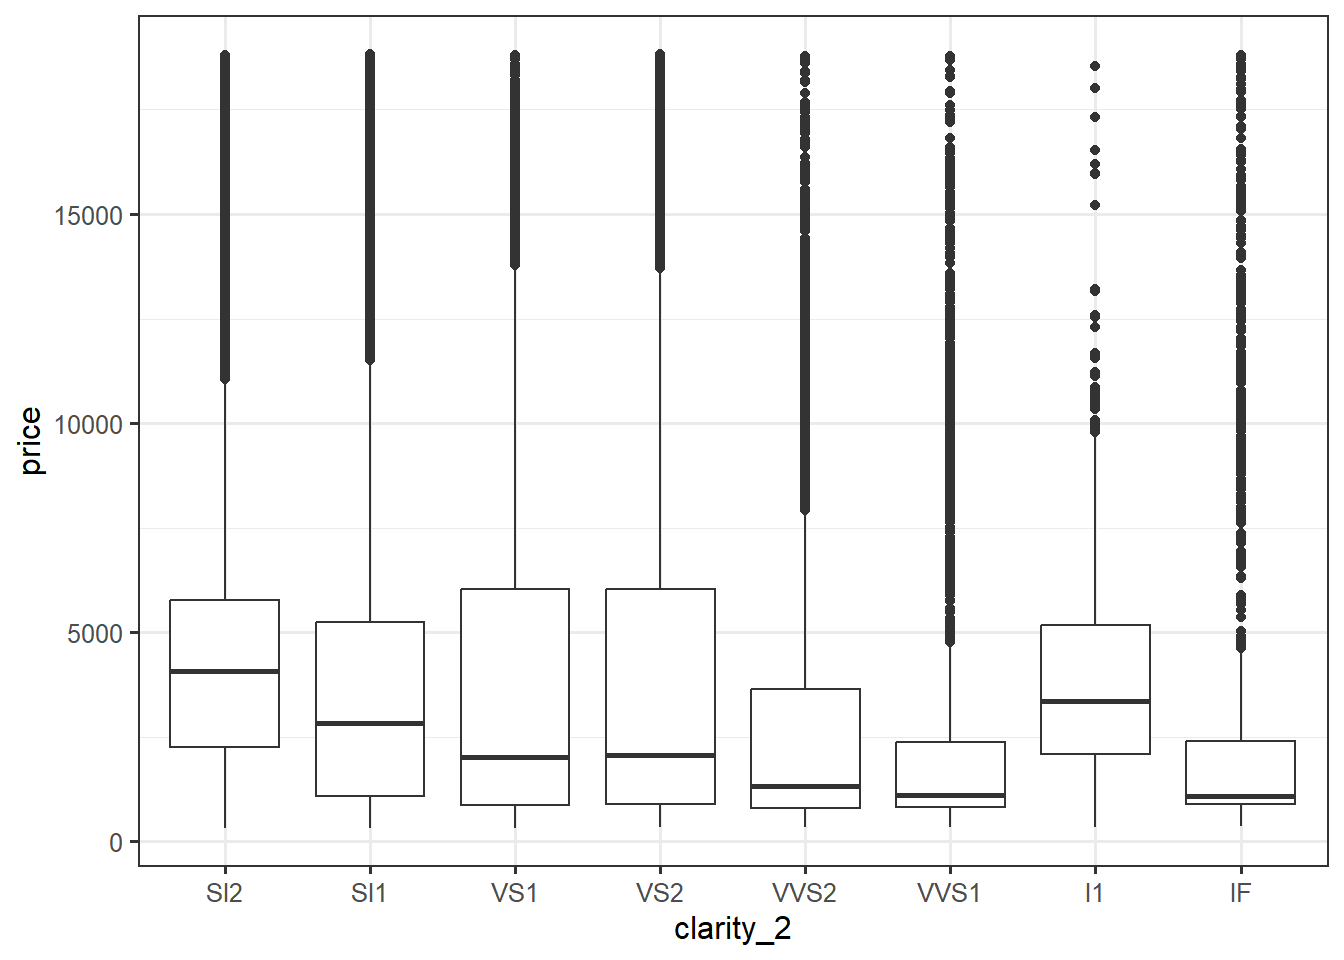
出現順に並び替え
- forcats::fct_inorder()
ggplot2::diamonds |>
  dplyr::mutate(clarity_2 = forcats::fct_inorder(clarity)) |>
  ggplot2::ggplot() +
  ggplot2::geom_boxplot(
    ggplot2::aes(
      clarity_2, price
    )
  )
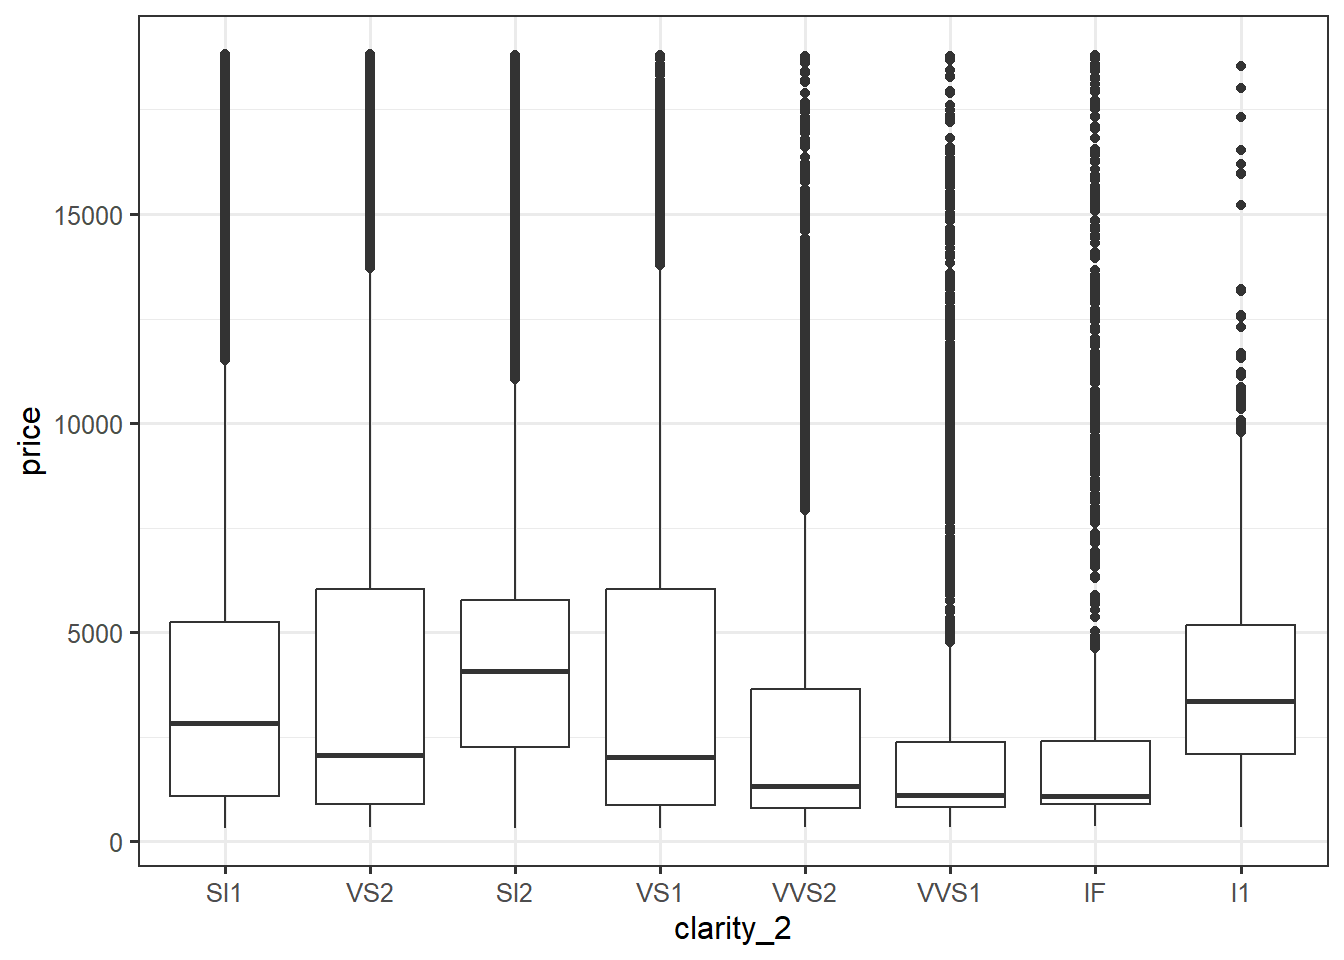
度数順に並び替え
- forcats::fct_infreq()
ggplot2::diamonds |>
  dplyr::mutate(clarity_2 = forcats::fct_infreq(clarity)) |>
  ggplot2::ggplot() +
  ggplot2::geom_boxplot(
    ggplot2::aes(
      clarity_2, price
    )
  )
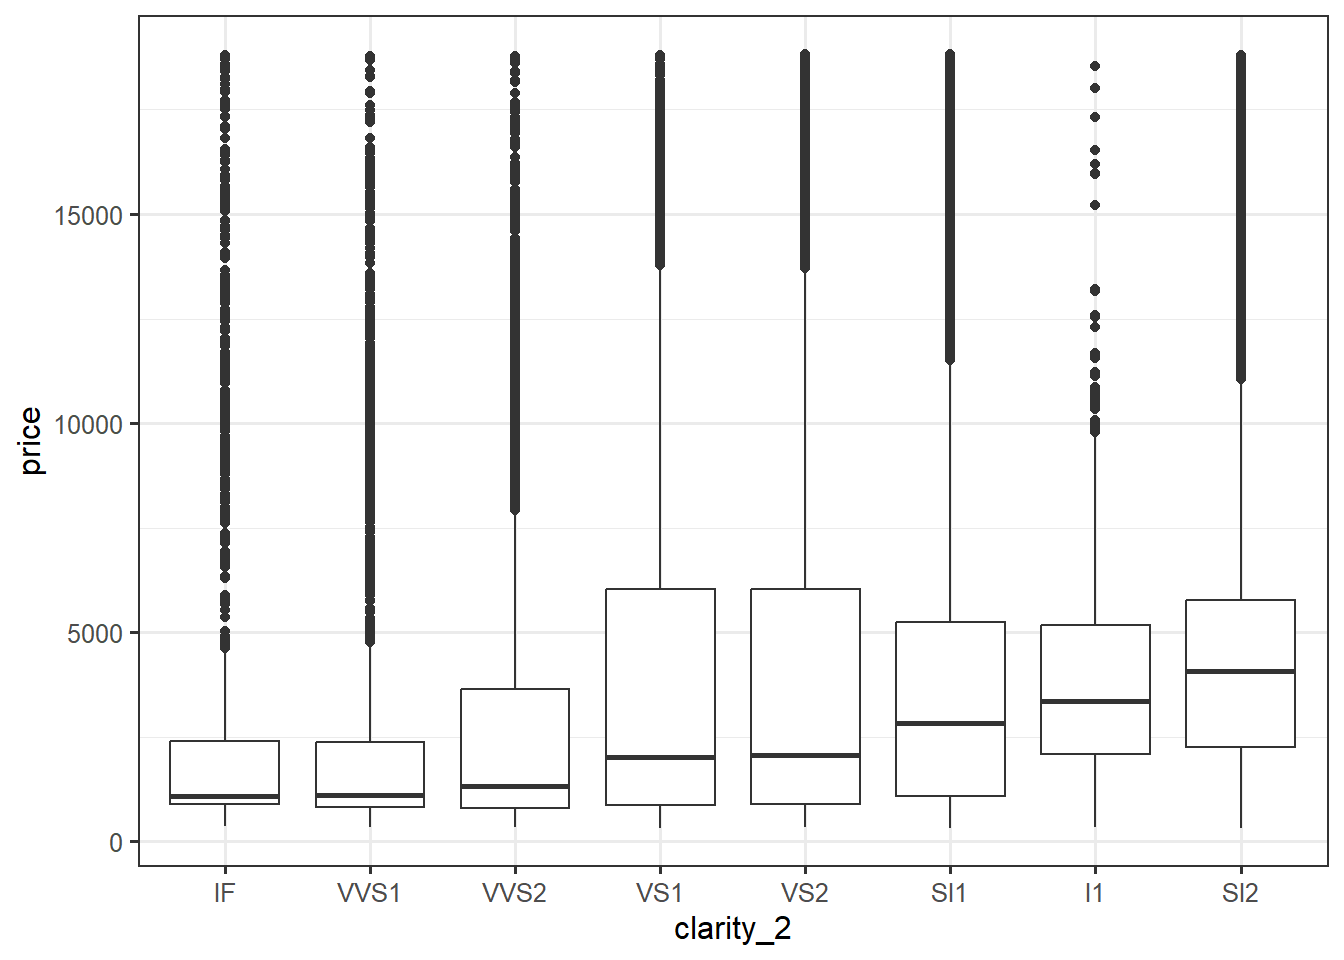
逆順に並び替え
- forcats::fct_rev()
ggplot2::diamonds |>
  dplyr::mutate(clarity_2 = forcats::fct_rev(clarity)) |>
  ggplot2::ggplot() +
  ggplot2::geom_boxplot(
    ggplot2::aes(
      clarity_2, price
    )
  )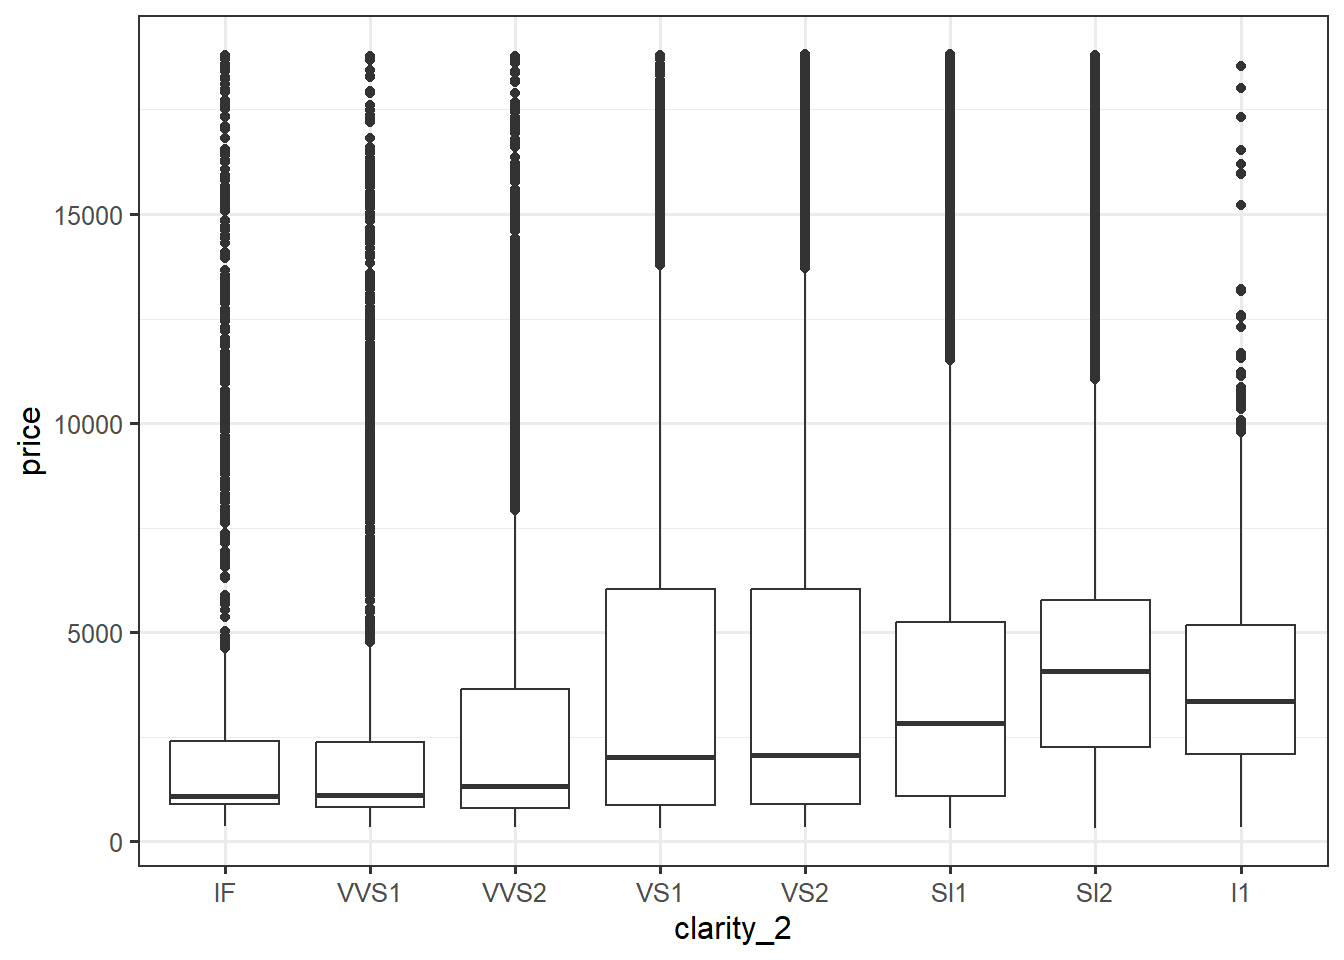
他の変数をもとに並び替え
- forcats::fct_reorder(変数名)
ggplot2::diamonds |>
  dplyr::mutate(
    clarity_2 = clarity |>  forcats::fct_reorder(price)
  ) |>
  ggplot2::ggplot() +
  ggplot2::geom_boxplot(
    ggplot2::aes(
      clarity_2, price
    )
  )
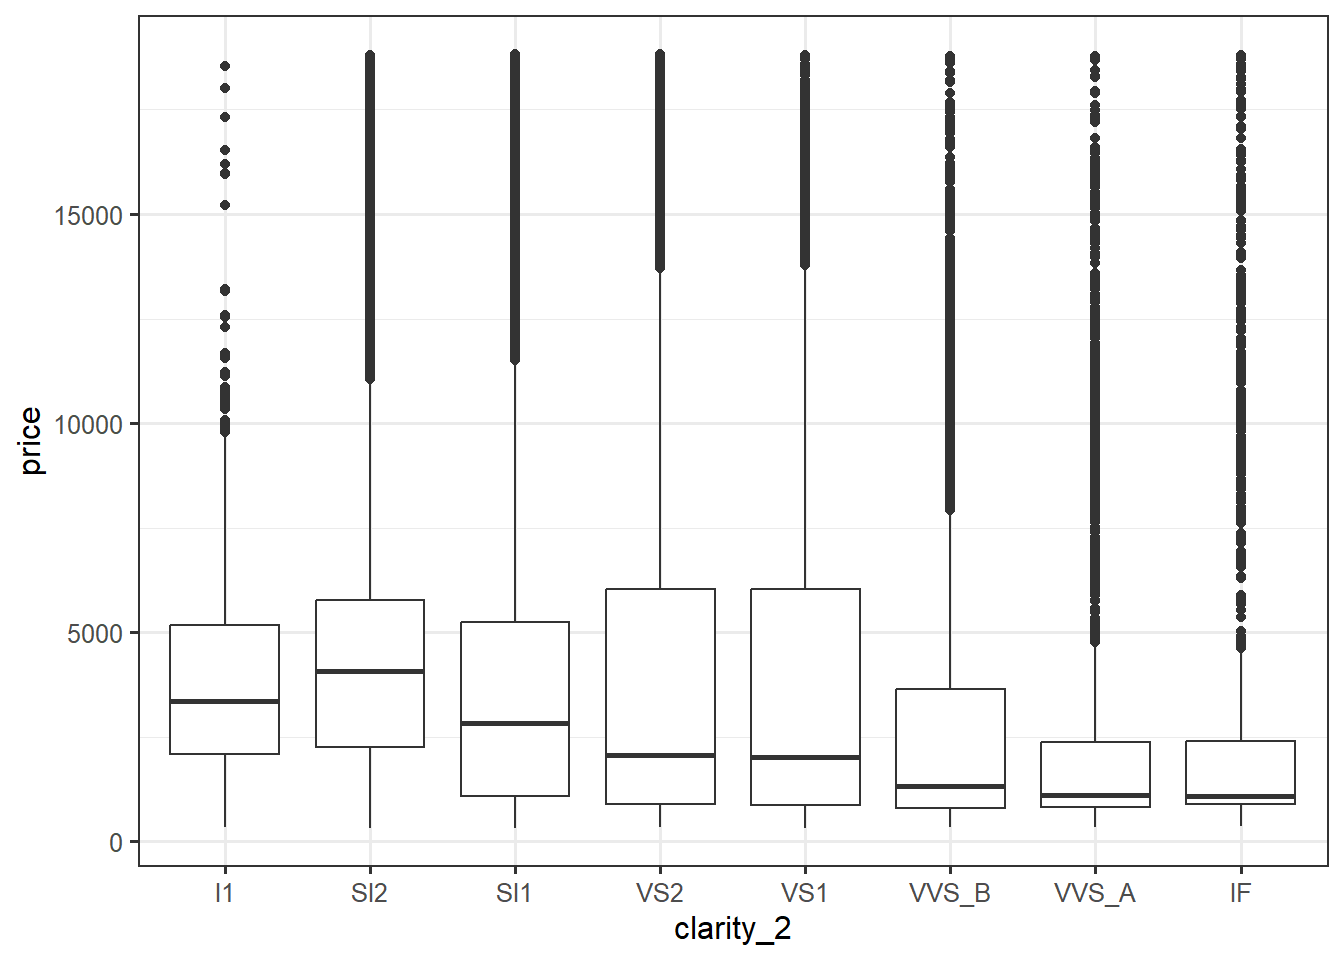
値の変更
- forcats::fct_recode(変数,新しい値 = “元の値”, …)
ggplot2::diamonds |>
  dplyr::mutate(
    clarity_2 = forcats::fct_recode(
      clarity,
      VVS_A = "VVS1",
      VVS_B = "VVS2"
      )
  ) |>
  ggplot2::ggplot() +
  ggplot2::geom_boxplot(
    ggplot2::aes(
      clarity_2, price
    )
  )
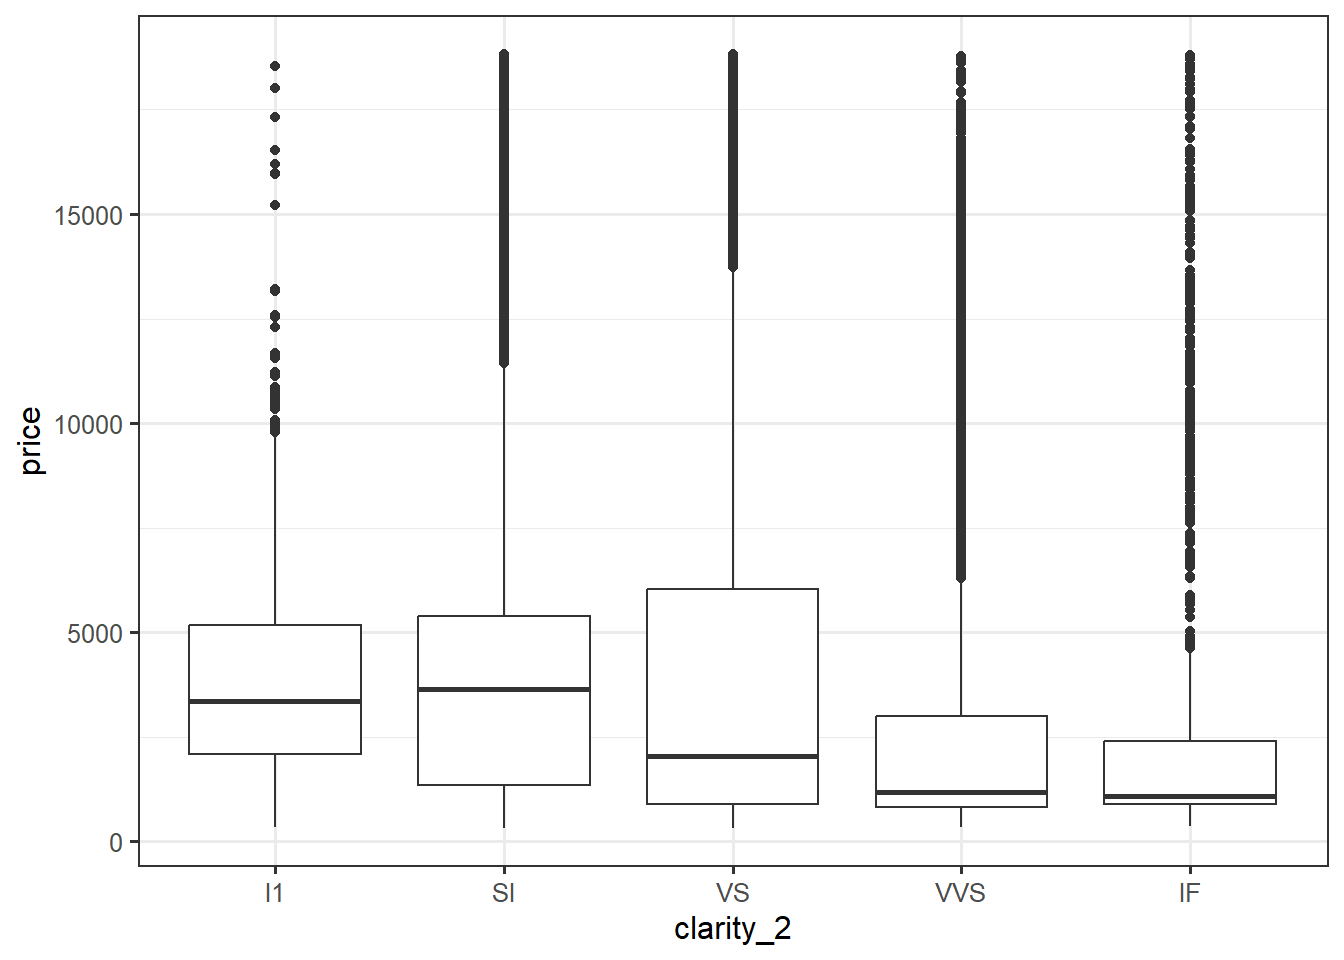
値の統合
- forcats::fct_collapse(変数, 新しい値名 = c(“統合元の値1”, “〃2”, …))
ggplot2::diamonds |>
  dplyr::mutate(
    clarity_2 = forcats::fct_collapse(
      clarity,
      VVS = c("VVS1", "VVS2"),
      VS = c("VS1", "VS2"),
      SI = c("SI1", "SI2")
      )
  ) |>
  ggplot2::ggplot() +
  ggplot2::geom_boxplot(
    ggplot2::aes(
      clarity_2, price
    )
  )
- マイナーな値を一括りに : forcats::fct_lump(変数,other_level = “一括り後の 値名”, n = 上位いくつまでを残すか)
ggplot2::diamonds |>
  dplyr::mutate(
    clarity_2 = forcats::fct_lump(
      clarity,
      n = 5,
      other_level = "その他"
      )
  ) |>
  ggplot2::ggplot() +
  ggplot2::geom_boxplot(
    ggplot2::aes(
      clarity_2, price
    )
  )